Portfolio
Projects
A physical card world and a walkable neighborhood story—two ways of making information feel close enough to use.
SideQuest · Card Design System
Sweet Rot
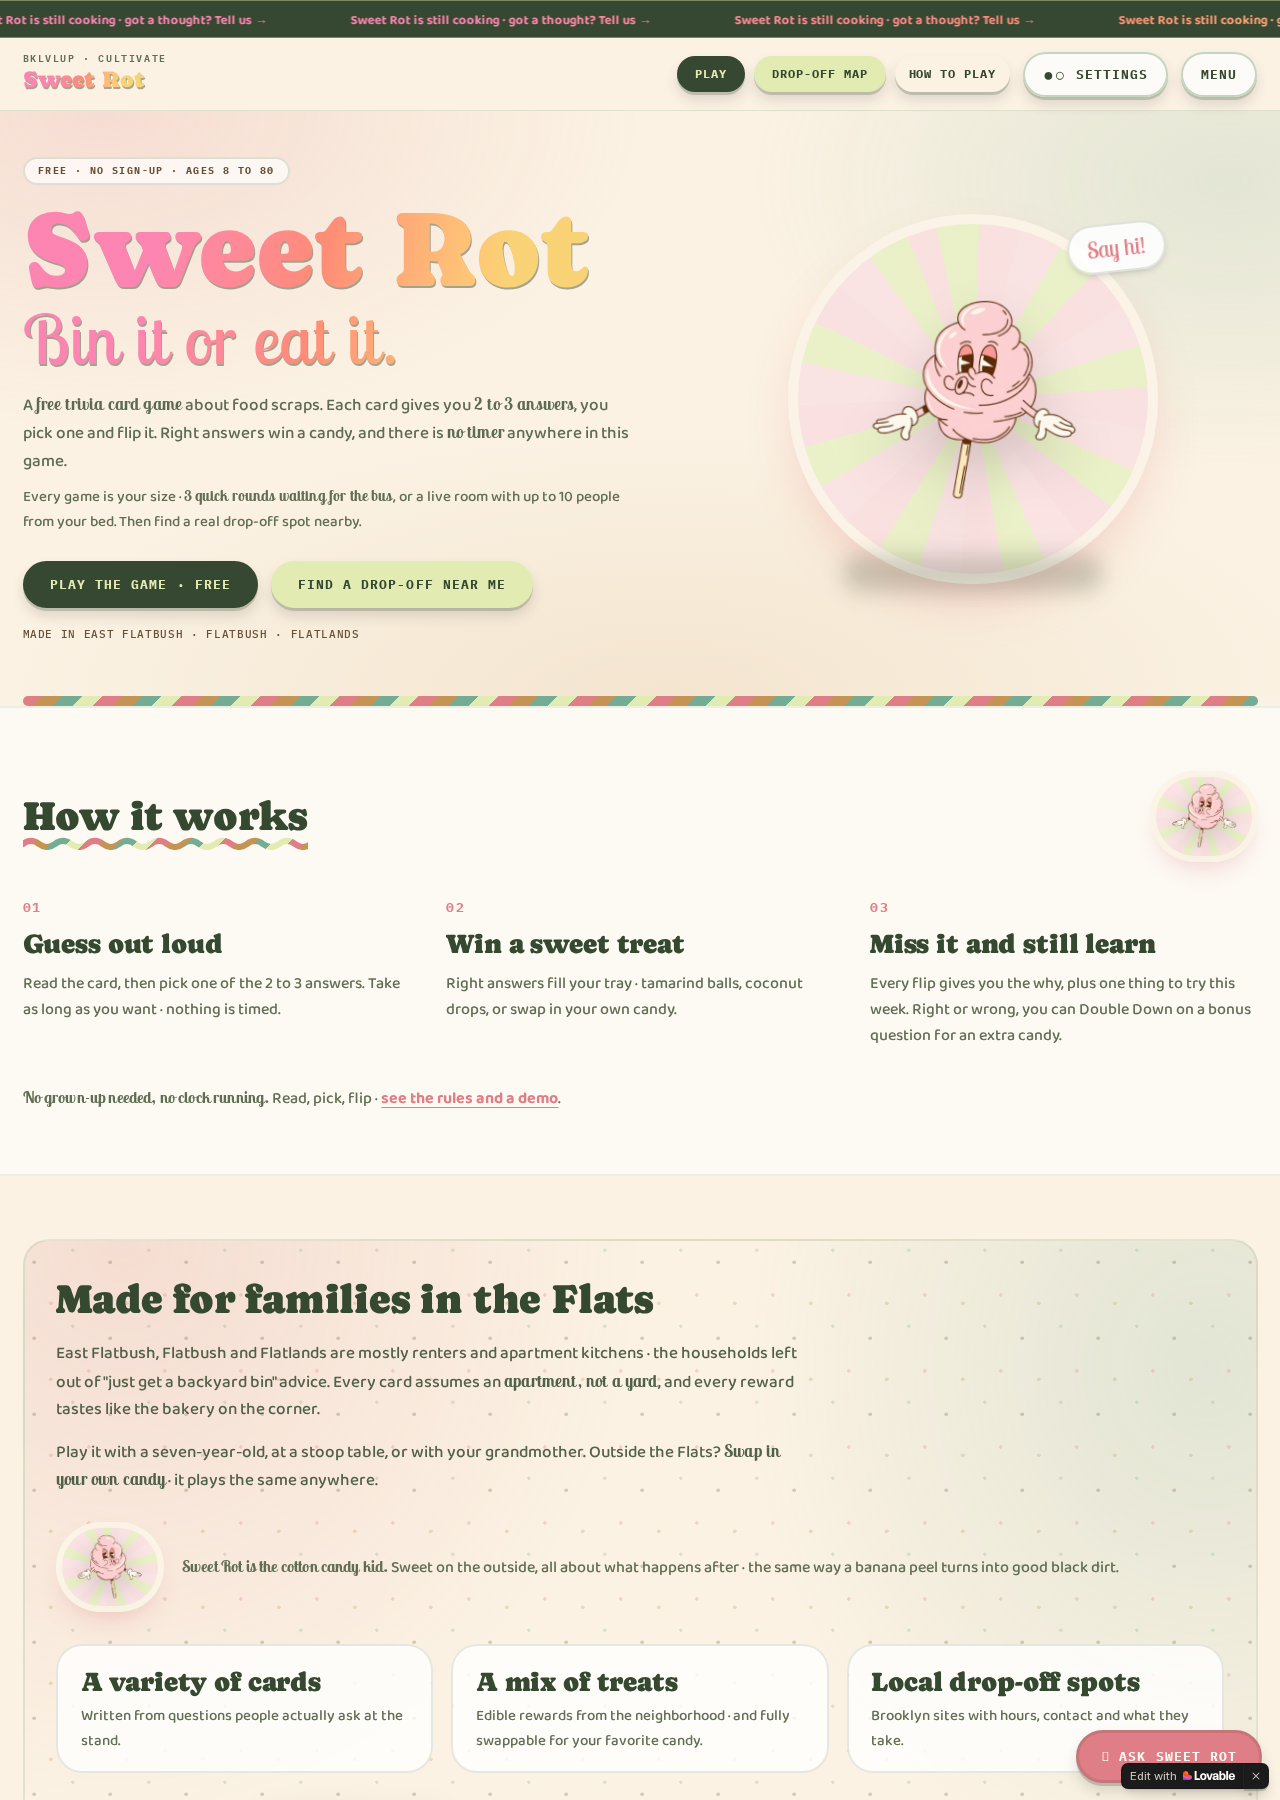
The Idea
Composting can feel technical or easy to ignore. Sweet Rot makes it social: a trivia card game where learning happens through play and conversation.
What I Designed
A physical card system and connected web concept. I developed the visual direction, designed the cards, and sent the work to Rose Hsu, BKLVLUP's Brand + Experience Lead, for feedback.
Accessibility
High-contrast use and screen-reader support were part of the concept from the start. The goal was not only to make something attractive, but to make more ways into the experience.
The Next Form
The physical cards are the beginning. I want to continue Sweet Rot after the program and explore how its questions, play, and community energy could become an app.
A Tangible Finish
Sweet Rot arrived at the Community Report Back as something people could hold. The treat bags were secured, and the project had a physical presence in the room.
EcoPower '26 · Ground3D Collaboration
Infrastructure Walking Tour of The Flats
Infrastructure Walking Tour of The Flats
Project visual coming soon
The Challenge
What isn't documented can't be defended. The Flats holds markets, playgrounds, substations, green spaces, and community institutions that are easy to pass without knowing their histories.
My Contribution
I led GIS mapping work on Felt with Ground3D, wrote narrative annotations so each point felt like a story rather than a coordinate, conducted street interviews near Brooklyn College, and assessed shade, water, flood risk, and accessibility along the route.
The Experience
“It's basically a map you could pull from your phone and immediately get on a self-guided tour to know what you actually have access to. It's all resources for you to know what you want to fight for or already have access to.”
What We Built
The Green Book: Energy Resilience Edition—a live interactive map with 11 stops across East Flatbush, Remsen Village, and Canarsie, plus a street-interview script and community pact research.
What's Next
The map is live. The next phase is outreach to businesses willing to become climate-emergency resources for cooling, charging, water, and information.
EcoPower ’26 · Cohort Work
Built together in The Flats
Four live community projects developed by Operators alongside neighborhood partners. These are collaborative outcomes; Belle’s individual contributions are identified within each project.
Environmental & Data
Community Resilience Hub Survey
A cohort-built, accessible survey for Brooklyn’s first Community Resilience Hub, developed in English, Spanish, and Haitian Creole to bring resident voices into decisions about emergency support, food, shelter, water, and programming.
Belle’s contribution
Contributed to the shared research and design process connecting local heat-vulnerability data, accessibility, and community priorities.
Community & Civic
The Green Book: Energy Resilience Edition
A collaborative, phone-ready map with 11 stops across East Flatbush, Remsen Village, and Canarsie, documenting energy infrastructure, community resources, green spaces, and neighborhood history.
Belle’s contribution
Mapped locations in Felt, wrote narrative annotations, supported street interviews, and assessed the route for shade, water, flood risk, and accessibility.
Story & Media
Flats Rising Communication Strategy
An emergency-communication framework designed around different languages, generations, learning styles, and levels of digital access rather than a single default audience.
Belle’s contribution
Participated in the summer-wide research environment that informed accessible outreach, community-pact research, and neighborhood preparedness materials.
Tech & AI
Powering the Block Energy Clinic
A neighborhood-specific energy clinic and senior cooling-event plan covering home heat vulnerability, blackout preparedness, and nearby heating and cooling resources.
Belle’s contribution
Supported the cohort’s broader exploration of how environmental information can become practical, accessible tools for East Flatbush residents.
Field Work
Additional Work
Researched Mapping Inequality's 1930s Brooklyn redlining maps, heat vulnerability reports, and NYC environmental justice air-quality monitoring.
Observed that emergency experiences should be designed for single-person operation, not only ideal team conditions.
Questioned the instinct to record a disaster for media when it can feel dismissive of the incident itself.
Conducted street interviews near Brooklyn College and listened for the background stories behind residents' answers.